
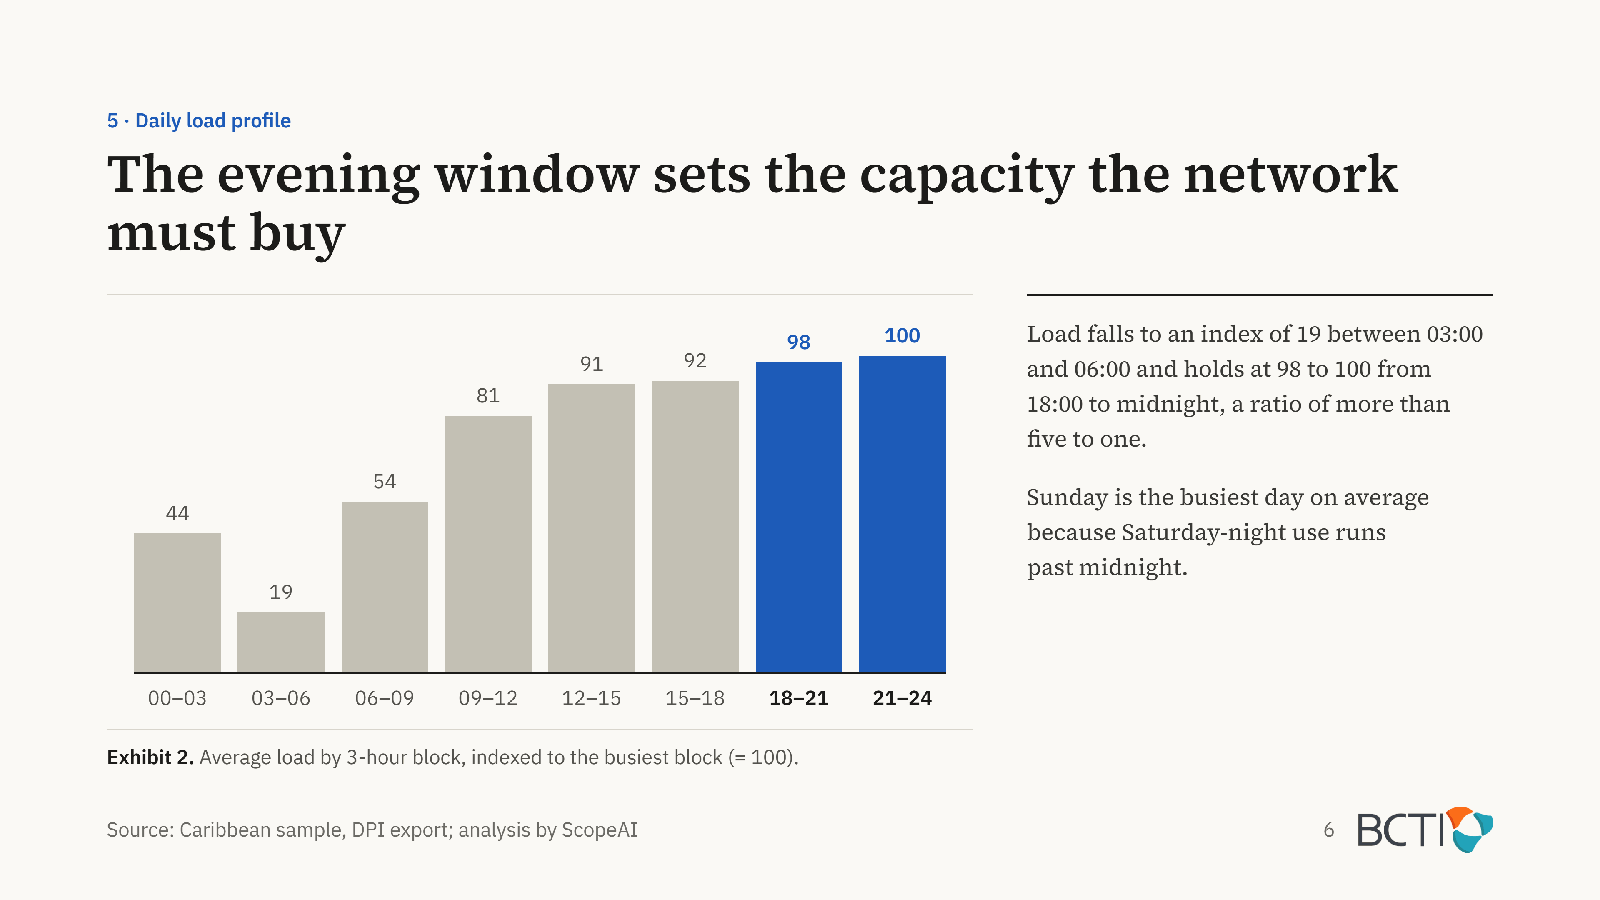
Daily network load.
Question: when is load highest within this network sample? The chart uses an index, with the busiest block set to 100.
How to read this example
An indexed profile compares the shape of demand across time blocks. It does not state absolute capacity, spare headroom or a guaranteed saving. Those questions need the relevant source measurements and operating context.
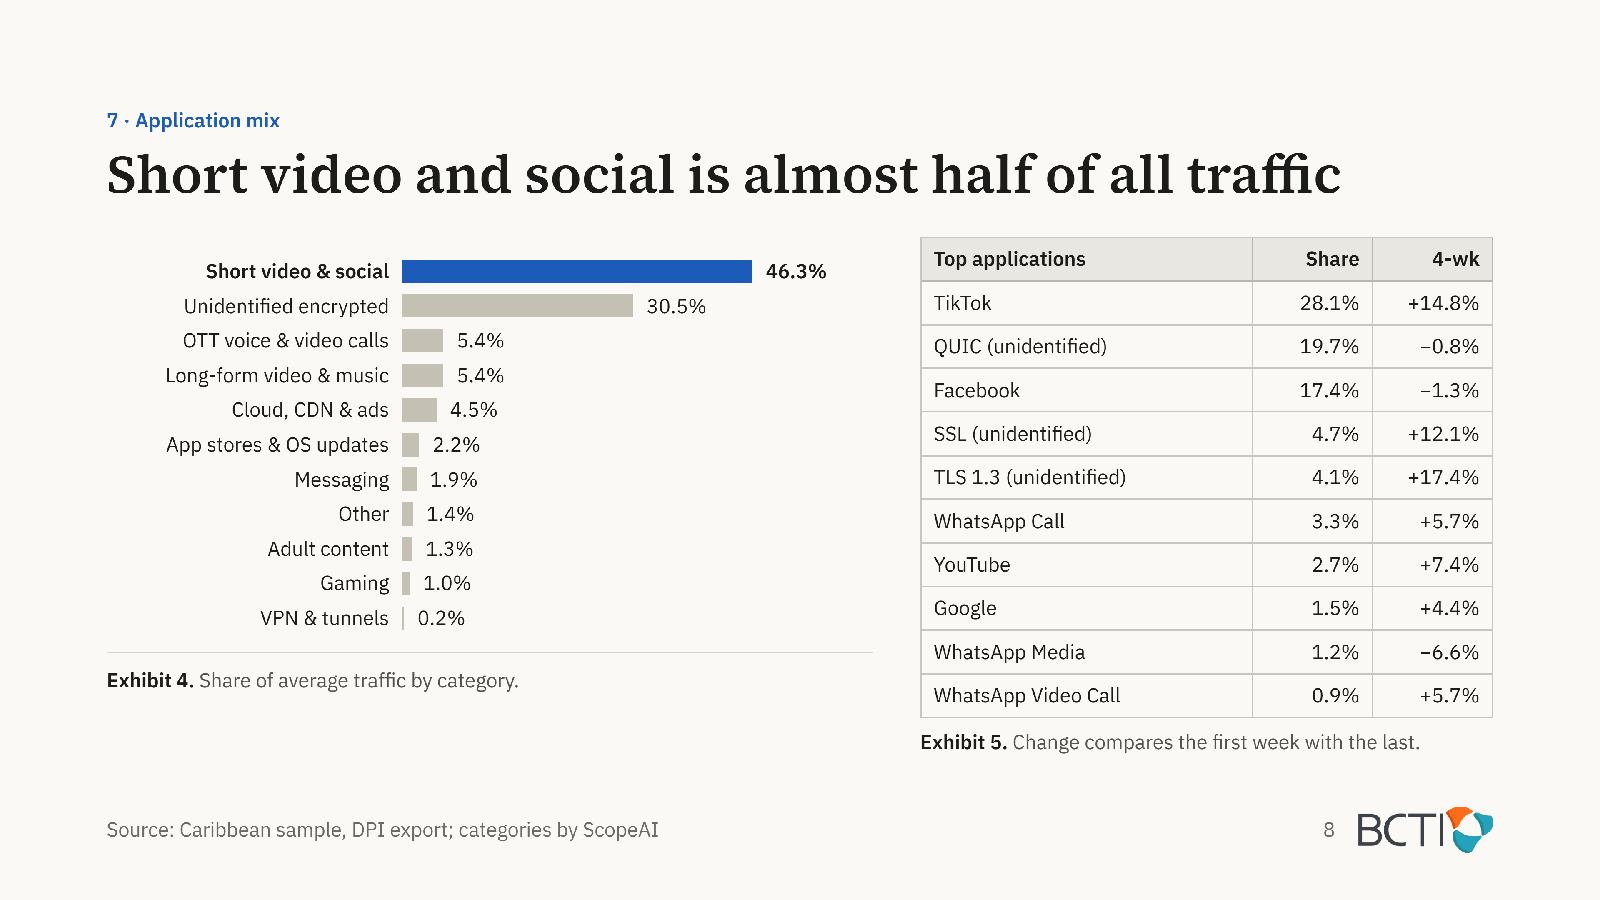
Application traffic mix.
Question: which application categories account for traffic in the sample, and how did their shares change?
Keep the evidence distinct.
The Caribbean examples describe one network sample. The separate Canada and USA documents are modelled illustrations; they should not be treated as measured operator case studies. No customer outcome or general market saving is claimed here.
Which question should your report answer?
Define the decision, the inputs and the output with BCTI.